Introducing SkillCorner's Expected Possession Value (EPV)
A new value creation model powered by the full context of tracking data.
.webp)
Value creation in football has traditionally been measured through a narrow lens: shots, goals, or the events that bring the ball closer to the opposition's goal. These indicators capture the end product of an offensive play, but they tend to overlook the majority of the remaining actions.
Common data providers rely on static images and limited context to quantify value creation: built on event data, the available models only track the players who actively engage on the ball.
This approach fails to reflect the dynamic, situational nature of the game. It misses the key information needed to understand how a team's goal-scoring probability evolves moment to moment: the positioning of off-ball players, their speed and direction of travel, the tactical context captured through phases of play, and much more.
What is Expected Possession Value?
SkillCorner's Expected Possession Value (EPV) measures the probability of each team scoring in the near future, defined as within the next 30 seconds, or before the next interruption in play.
Because it is built on tracking data, it continuously captures the position, speed and direction of every player on the pitch, reflecting the real game scenario rather than a static snapshot.
This finally allows for more detailed value attribution to every action, including backward passes and switches of play, not just shots and goals. It also means previously overlooked positions — central defenders and midfielders — are finally rewarded for the value they create, even when it doesn't come from a clear progressive action.
Context sits at the centre of this. Because the model reads the full game situation, it understands that two possessions in the same zone of the pitch can carry vastly different value depending on the phase of play. Within the middle third, the same situation can jump from an EPV impact of under 2% in a settled Create phase — organised possession against a set mid block — to over 20% in Transition, when the defensive shape is left unorganised.
Video Explainer
What We Deliver
EPV is available as a suite of aggregated metrics, each split across Possession, Pass and On-Ball Involvements (Possession and Pass combined):
- EPV Average — the mean value across all of a player's actions, capturing their full distribution of impact.
- EPV Baseline — the value of a player's routine actions, isolating their everyday contribution by excluding their most impactful events.
- EPV Peak — the value of a player's most impactful actions, capturing their game-changing, high-value contributions.
We split values this way to reveal a player's profile, separating those who deliver a consistently high routine level from those whose impact is driven by rare, game-changing moments.
Beyond aggregates, EPV enriches every individual player possession within our Dynamic Events with a full set of flags.
Each possession and pass is broken down into its for, against and total components across the start and end of the action, giving you the granularity you need to build your own bespoke, value-based metrics.
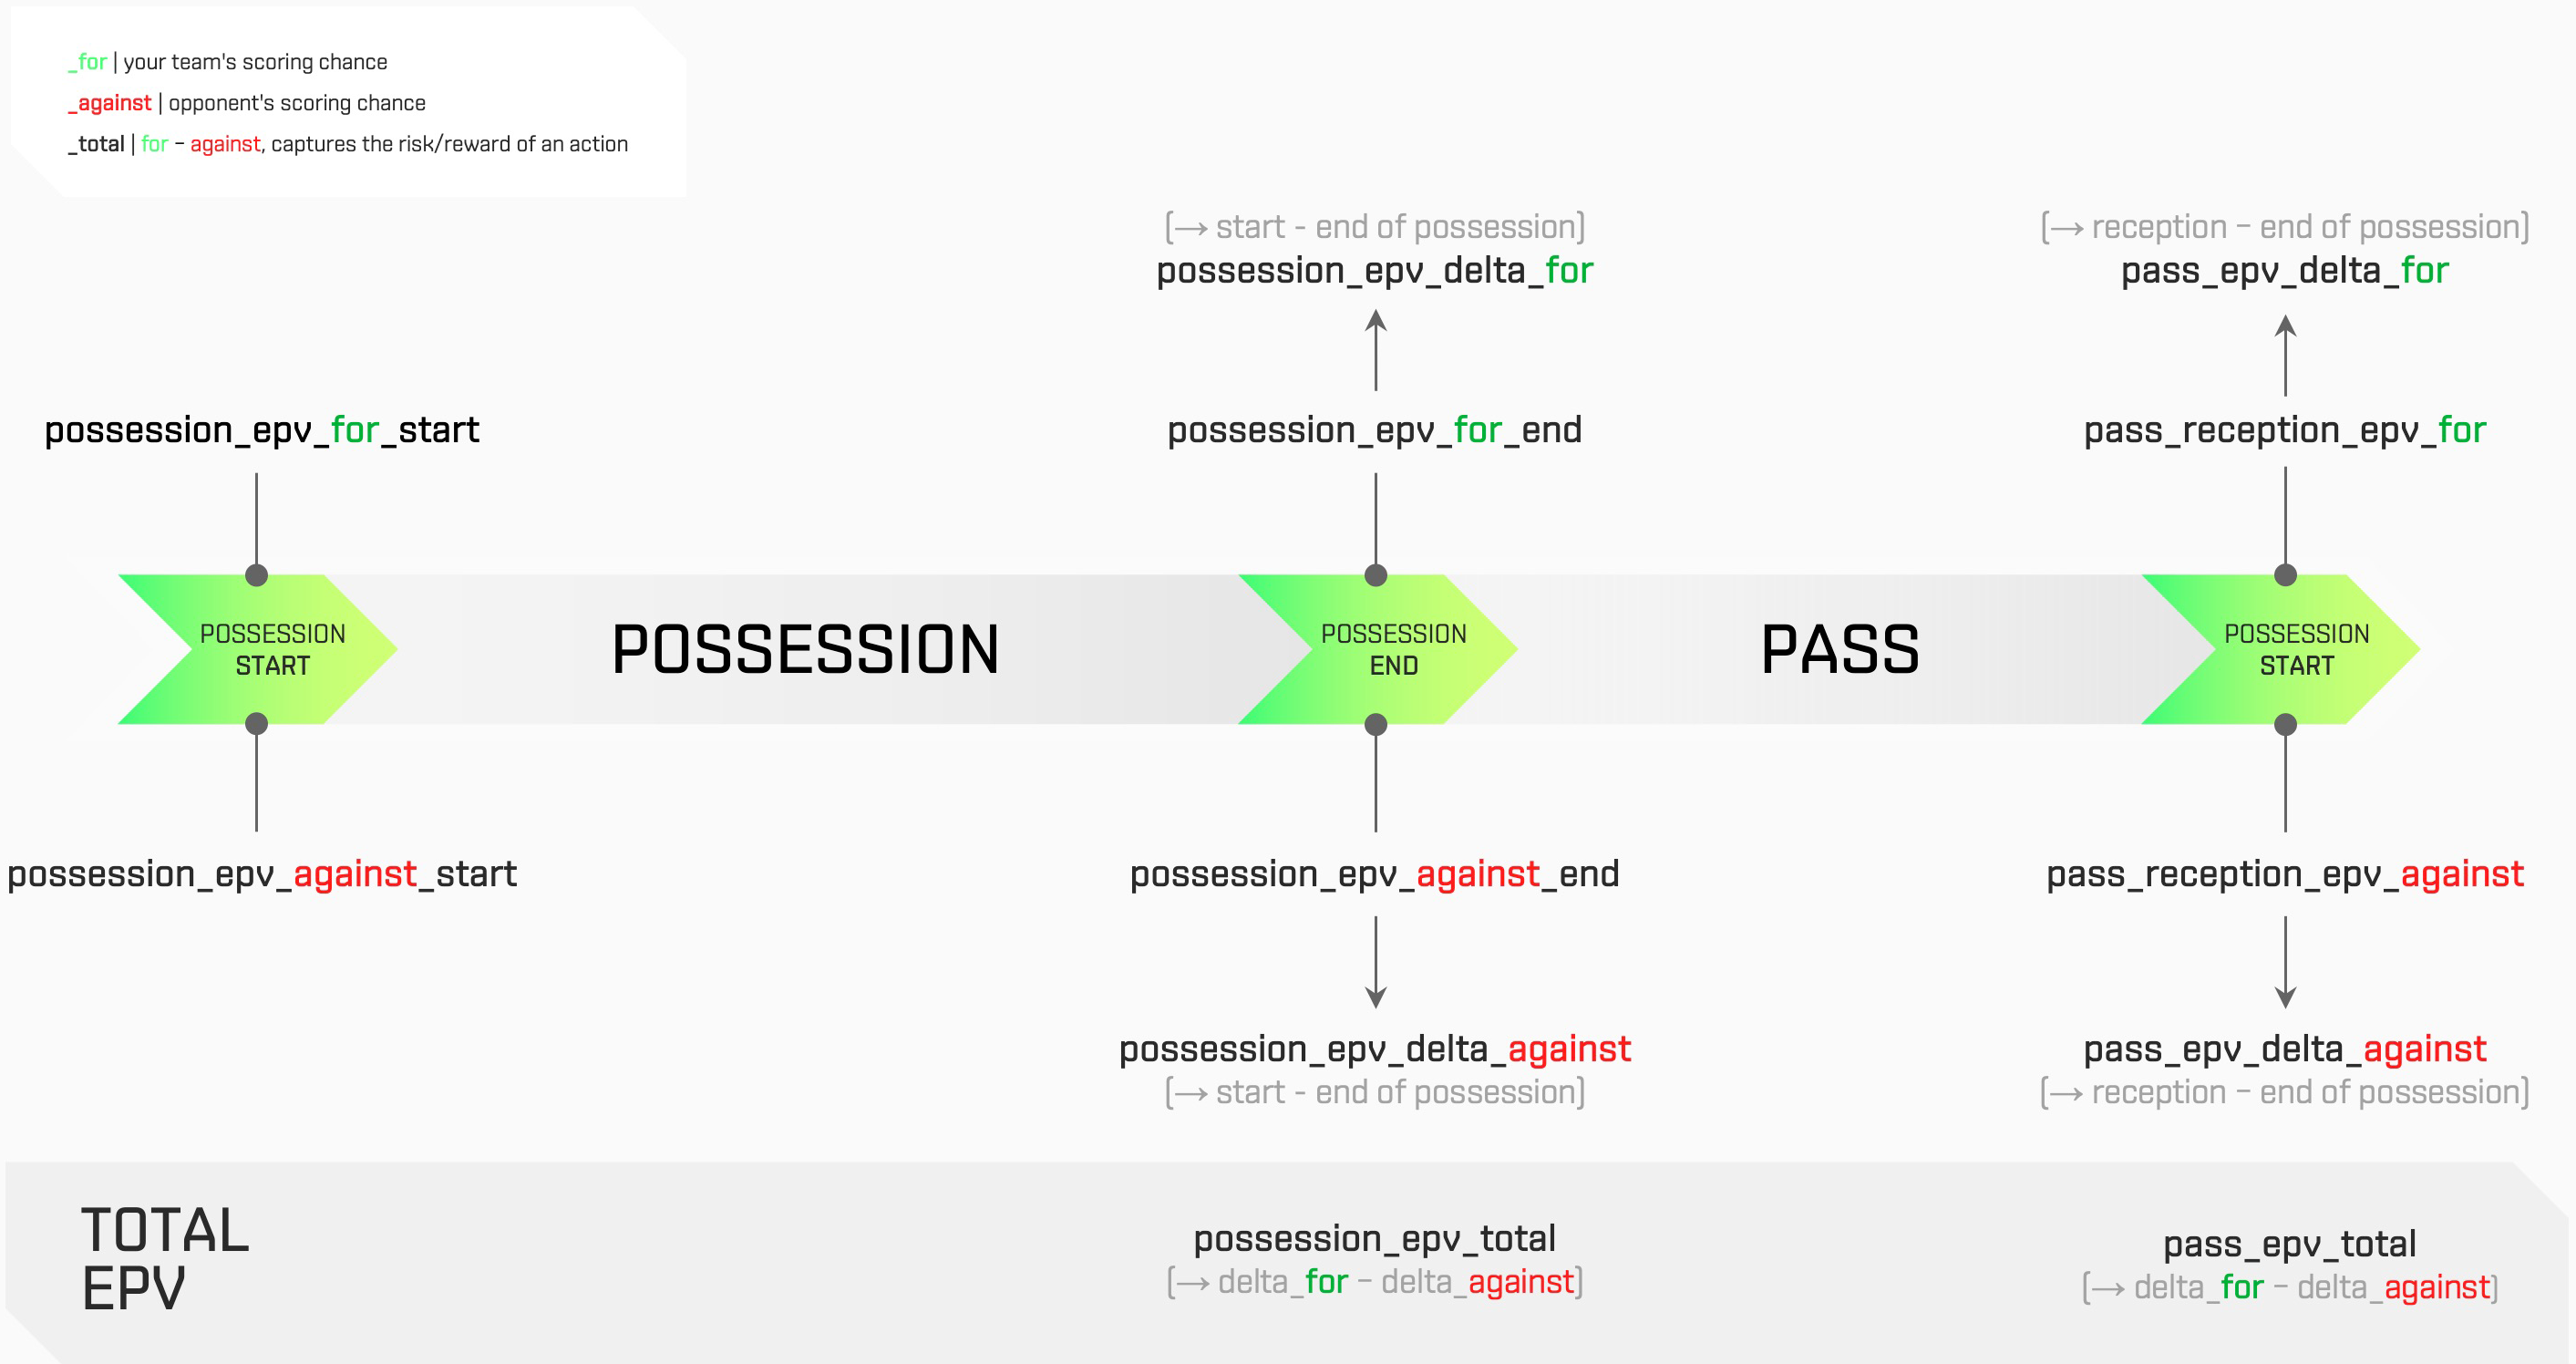
SkillCorner’s EPV finally allows you to identify the players who have the biggest impact on the game, and in a wider context, the highest-value situations on the pitch, opening up new applications across match analysis and R&D.
EPV Case Study: Attackers
Because EPV separates value generated through passing from value generated through carrying, it becomes possible to profile players by how they create danger, not just how much.
Thanks to the new aggregated metrics, we can quickly separate players who create value by driving the ball from those who do it by passing.

The top-left quadrant identifies players who create value mainly by carrying, the bottom-right those who create it through passing, and the top-right the most complete profiles, excelling at both.
EPV Case Study: Midfielders
The depth of SkillCorner’s Dynamic Events lets us take the analysis further, down to the level of individual actions. Here, we weigh the average EPV each pass generates against how likely it was to be completed.
The result is a risk-reward profile: average EPV per completed pass on one axis, pass safety — the expected completion (xPC) of those passes — on the other.
The top-left quadrant groups midfielders with high pass safety but lower value per pass; the bottom-right those with higher value per pass at lower safety; and the top-right those combining high value with high completion, within the competition.

EPV is the newest addition to our Game Intelligence package. Get in touch to explore what tracking-powered EPV can unlock for your team.
%20(1).png)