

How to Build an Effective Player Index
Choosing metrics and weights, and avoiding the risks that can skew your rankings and lead you to the wrong players
.webp)
You have identified a hole in the squad: a deep-lying playmaker. But going from that need to the scouting team’s final recommendation is a long road. In this article, we will look at a key, foundational stage of this process: building a player index.
We will go through the necessary steps to build an effective player index, from defining the targeted profile, a specific subset of metrics and their assigned weights, through to the three risk areas to watch out for.
Where It Fits in the Workflow
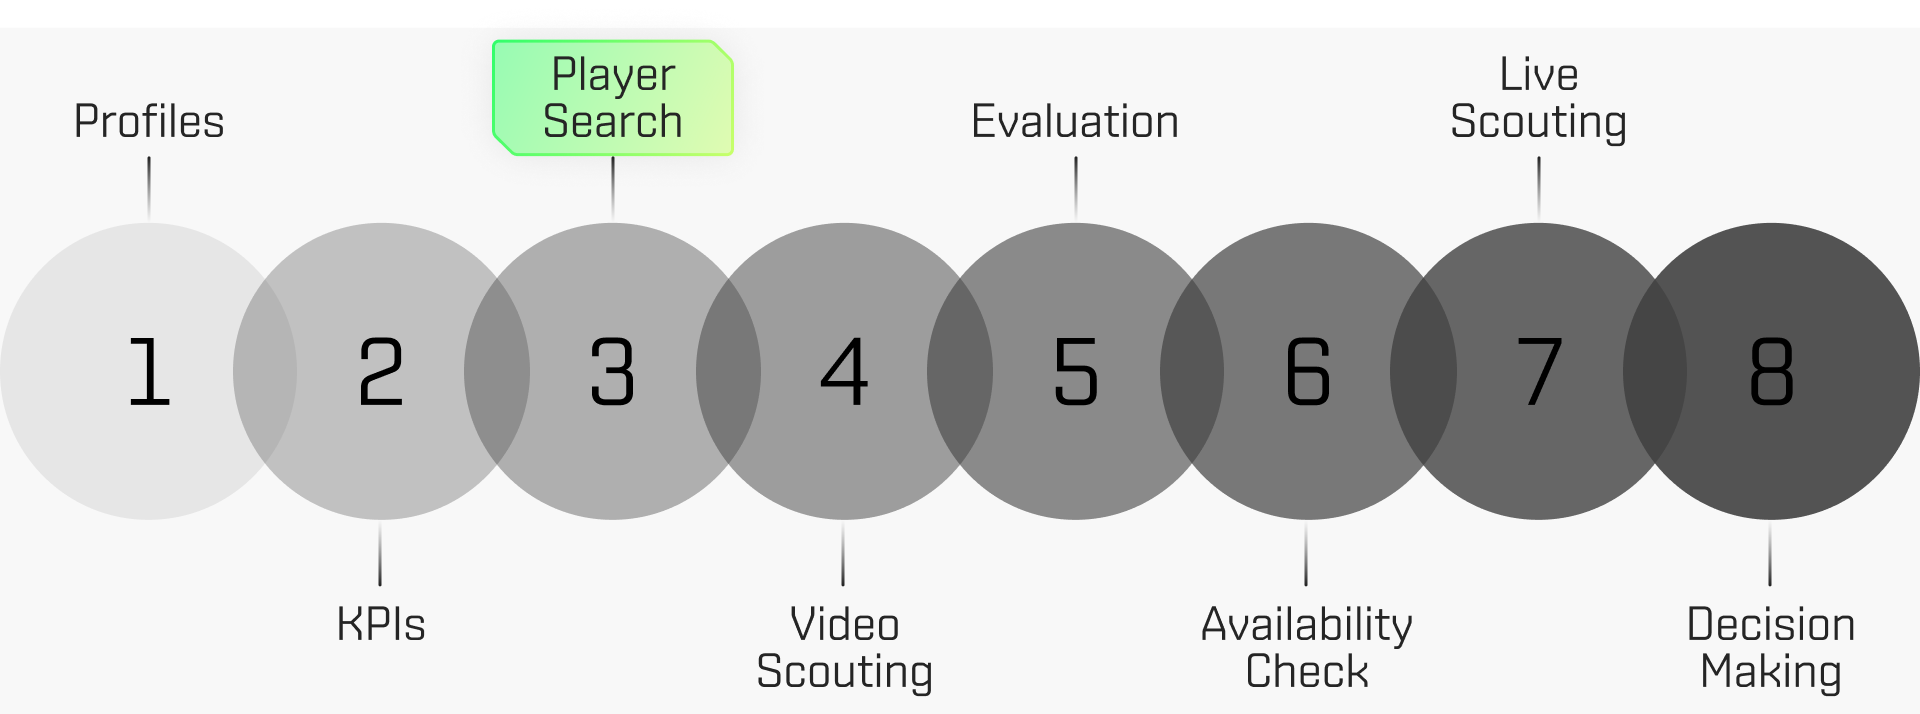
In a standard scouting workflow, building an index sits at the player search stage. It is the moment you need to narrow down a large set of players to a shortlist of possible targets. A poor choice of index metrics or an unbalanced weight distribution across them can prematurely remove players from consideration or ensure that unsuitable ones make it through to the next stage.
What is an Index and How to Build One
An index is a single number built from the weighted sum of normalised metrics. Indices are extensively used in football to filter down a large set of players into a shortlist of potential options who match a targeted profile.
To build one, you need three things:
- A target profile (e.g. a "ball-playing centre-back").
- A chosen subset of metrics that map to the attributes required for the target profile.
- Assigned weights for each metric.
That sounds simple enough, at first. The problem is that index rankings are subject to mathematical significance, which does not always link to practical, football relevance.
An index is, at its core, mathematics. It takes numbers, normalises them, adds them up according to their assigned weights and spits out a ranking. While that exercise will always produce a neat result, it doesn’t necessarily mean that the difference between two players ranked far apart will be meaningful in practical football terms. You have to account for the choice of metrics and how they are distributed across the whole sample.
Below, we will explore three potential pitfalls to watch out for when index-building: why they matter, how they could skew your results and how to avoid them.
Risk # 1 - Single Metrics with Poor Discrimination
The first question to ask about any single metric before adding it to your index should be whether it actually separates players. That is what the Coefficient of Variation (CV) tells you.
The CV is a metric’s standard deviation divided by its mean and multiplied by 100. It allows you to evaluate the spread of a distribution.
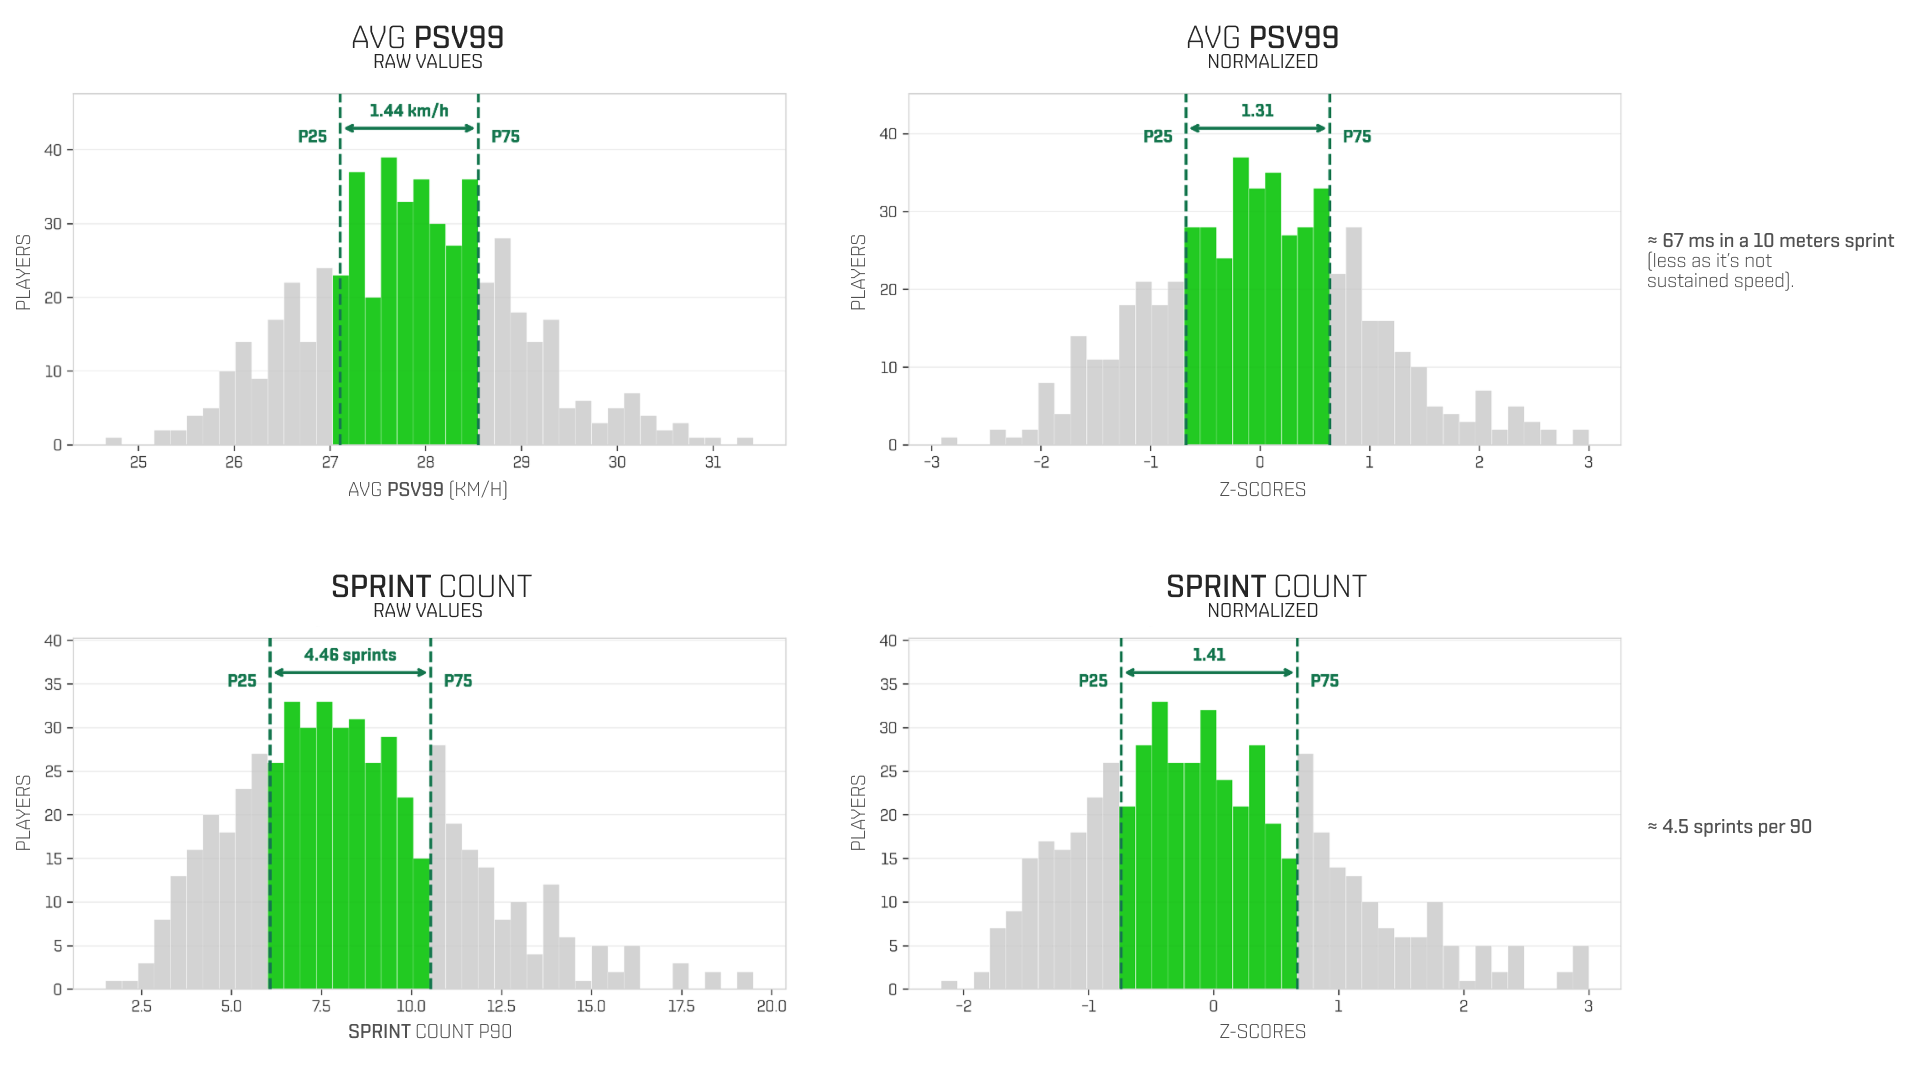
A low CV means most players score close to the average, so the metric is barely separating players. In the example below, using Avg PSV 99 — a metric with a CV of 3.9% — a 43-position ranking difference turns out to be driven by an 86-millisecond difference in a 10-meter sprint – statistically real, but basically imperceptible on the pitch.
(The sample used in this article is comprised of midfielders with at least 5 games of 60 minutes in the Big Five leagues. Conclusions depend on the sample)
Alternatively, Sprint count p90, a metric with 0.81 correlation with PSV 99 and a CV of 37.6%, captures much of the same signal, but separates players better.
To further illustrate that point, you can see that while the charts below show a similar difference between the 25th (P25) and 75th (P75) percentiles after normalisation, the PSV 99 one indicates only a 67 ms difference in a 10-meter sprint (not football-relevant), while the sprint count points to a difference of 4.5 sprints per 90 minutes (fairly relevant).
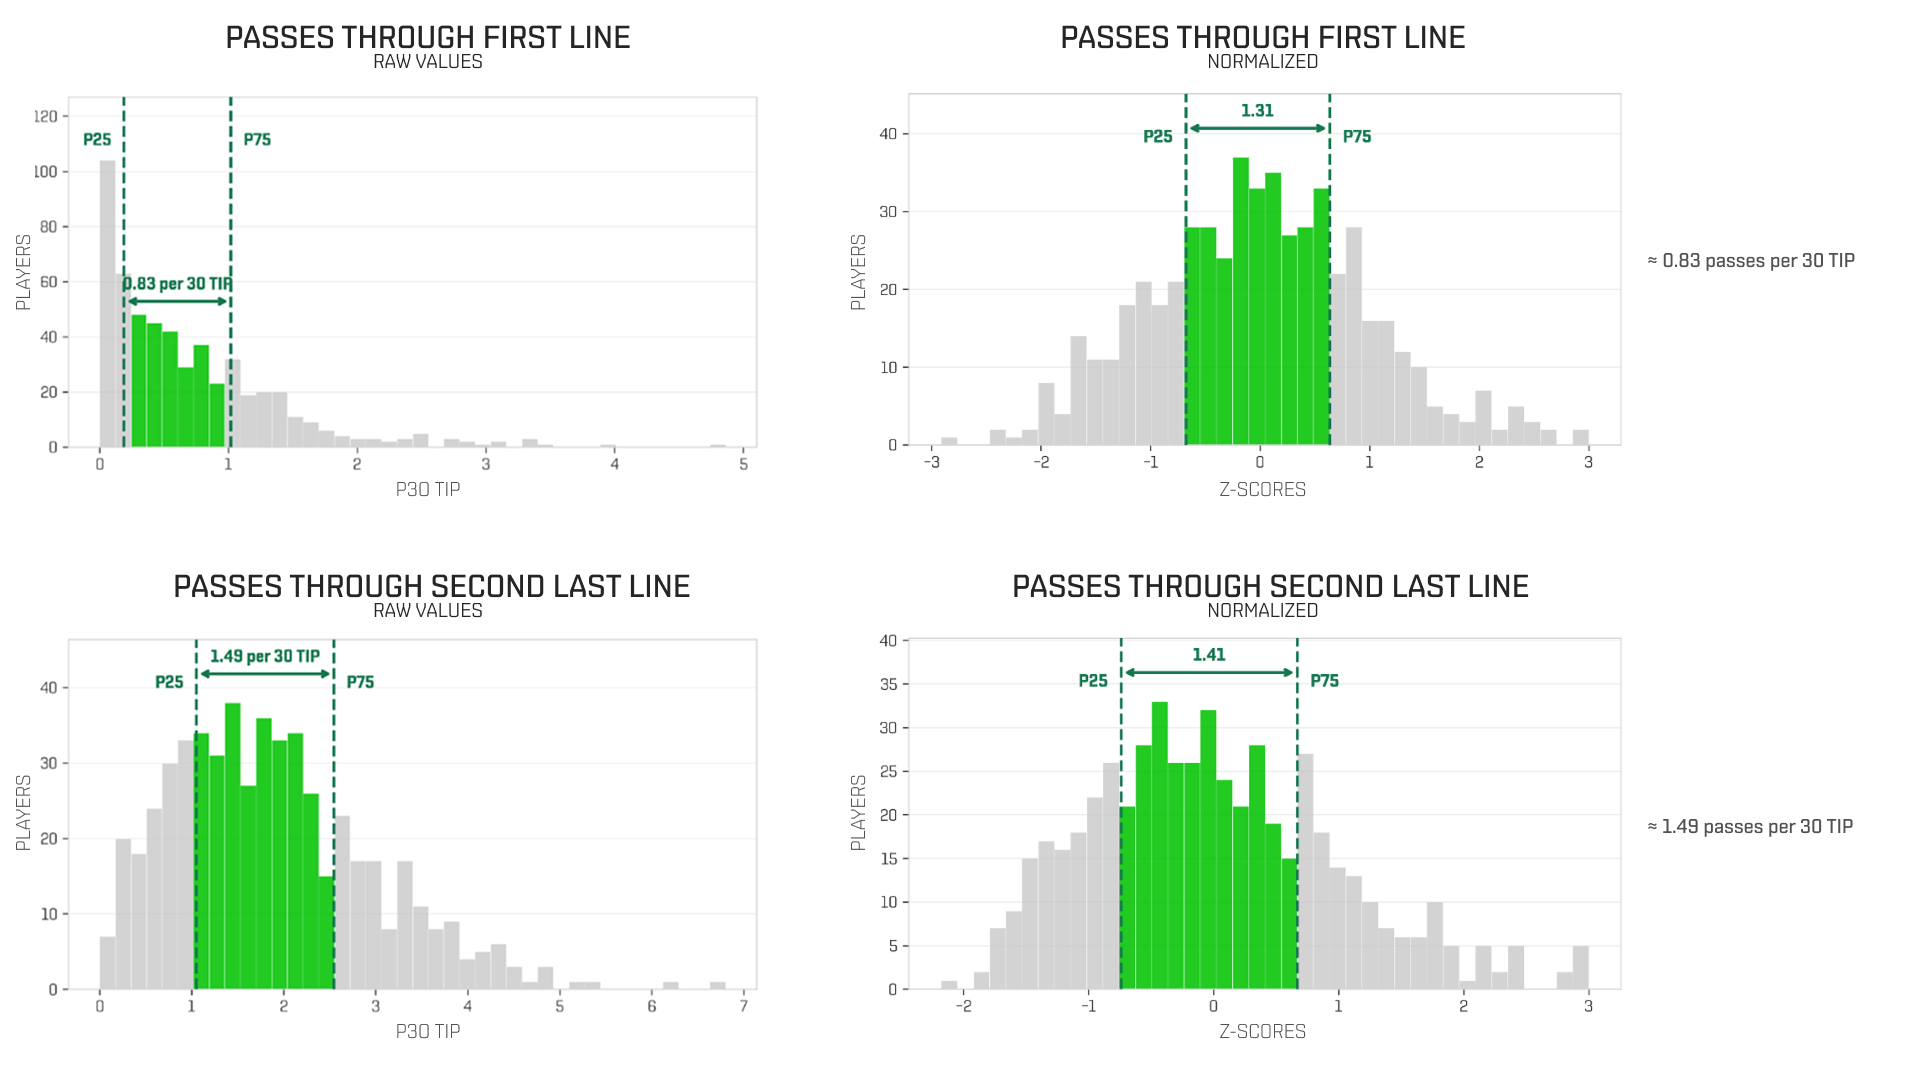
While a higher CV generally indicates better separation, on some occasions it can go too far and be misleading. Take, for example, Line-breaking passes through the first line (per 30 TIP). Its CV of 100% stems from the metric's relationship to a very specific midfield role. It doesn't do a good job of separating players; it highlights only a small handful of specialist number 6s, while most players compress near zero. This would only be useful if you are analysing specifically number 6s that receive before the first line.
As you can see above, a difference of only 1.41 passes through the first line per 30 TIP brings about an 88-position swing, driven by a metric with an extreme distribution.
A more reliable alternative for a broader search is Line-breaking passes through the second line, with a more workable 58.9% CV and a 0.64 correlation to the first-line metric. After normalisation, Passes through the first line show only a 0.83 difference between P25 and P75, against 1.49 for Passes through the second line for the same rank gap.
Evaluating a metric's discriminating ability, both statistically (via CV) and in practical football terms, is a critical step before including it in an index. Selecting metrics with stronger discrimination power that rely less on specific tactical scenarios provides a more reliable foundation for effective player comparison.
Risk # 2 - Overly Correlated Metrics
Separation power isn’t the only thing to keep in mind when selecting your metrics. Your next question should be how closely two or more of your metrics are correlated to each other.
For example, High Intensity Count (p90) and High Intensity Distance (p90) correlate at 0.966. Effectively, it’s as if you were including the same metric twice. The impact of these correlated metrics on the results will be higher than intended, doubling the weight of one single underlying attribute.
If you build an index with, say, five metrics, each meant to account for 20% of the final score – a fifth for Possessions, a fifth for Off-ball runs, a fifth for Intensity, etc – and two of those metrics are ultimately measuring the same ability, you end up with an unbalanced result.
Related Stories
%20(1).webp)
Leaving to Grow: Italy's Young Attackers Abroad

How to Spot Elite Talent Before Their Price Explodes